A B O U T
I am not a trained graphic designer, but graphic design is an intrinsic part of every project. Here are some of my attempts to create appropriate and interesting graphic work.
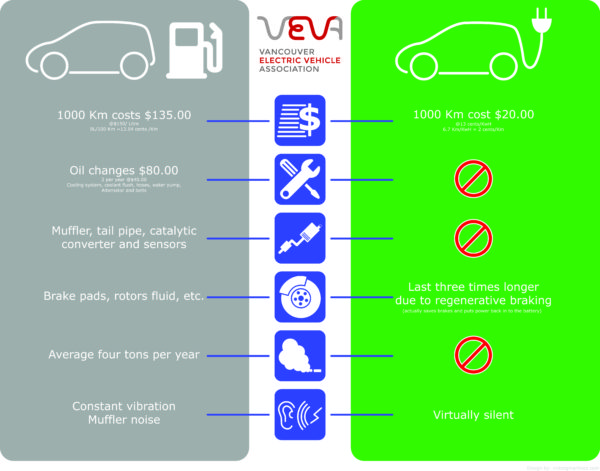
For a few years now I have followed the activities of VEVA (Vancouver Electric Vehicle Association), an enthusiast group of EV owners and promoters of clean transportation. They needed a volunteer to design for them a poster comparing some facts about ICE (Internal Combustion Engine Vehicles) and EVs. I offer my help and this is the end result.
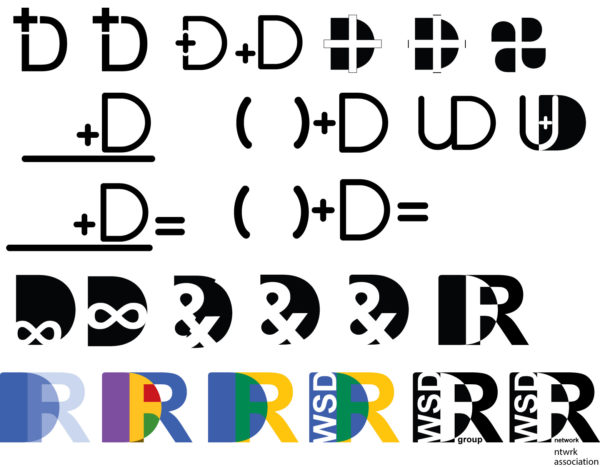
I was asked to lead the creation of the Design Research Network, which coordinates researchers and research groups from the Wilson School of Design, and connects them with collaborators and partners from other academic institutions, research institutes, industry, government, society, etc. The main purpose is to create a collaboration space to explore and innovate design-related problems utilising our faculty’s expertise and students’ enthusiasm. Here I present its logo development.
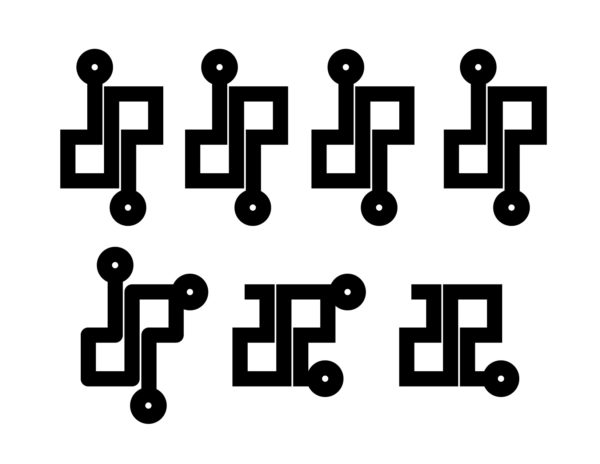
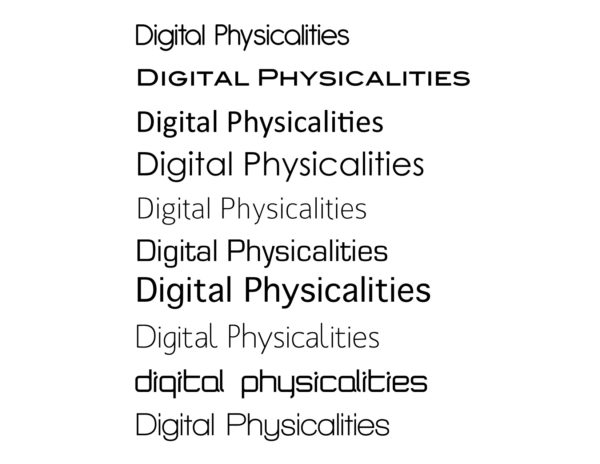
I am leading the research group Digital Physicalities, which goal is to explore and produce examples and experiments of the interactions between the digital and the physical world. More information about the group activities in the research section. Here I present its logo development, I started exploring fonts and the use of the D and P. Eventually it lead to the decomposition of these two letters into a resembling electronic circuit.
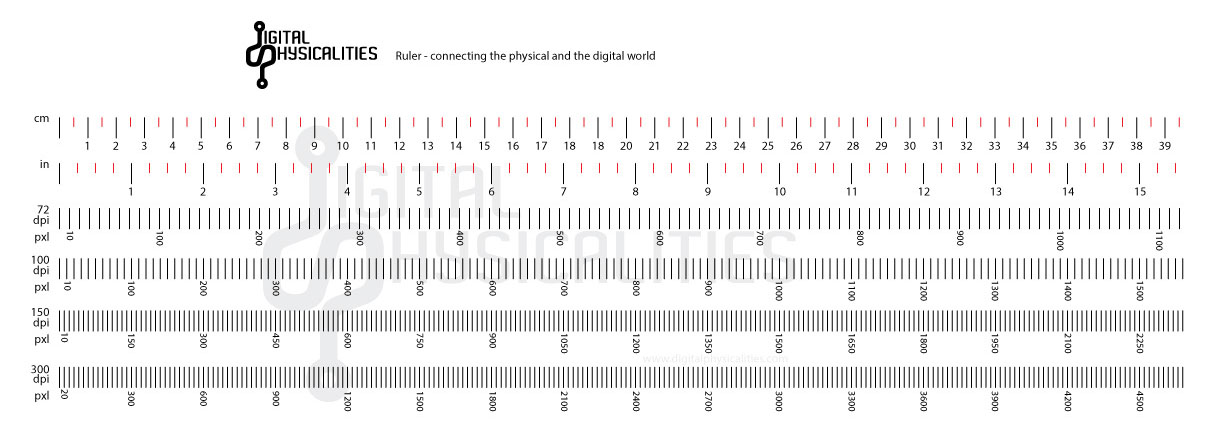
I usually struggle to teach beginners the relation between physical size, pixel size and resolution in images. So I thought of “connecting” the physical with the digital by making a ruler that links all three parameters, soon I hope I can offer on sale this ruler engraved on wood or aluminium.
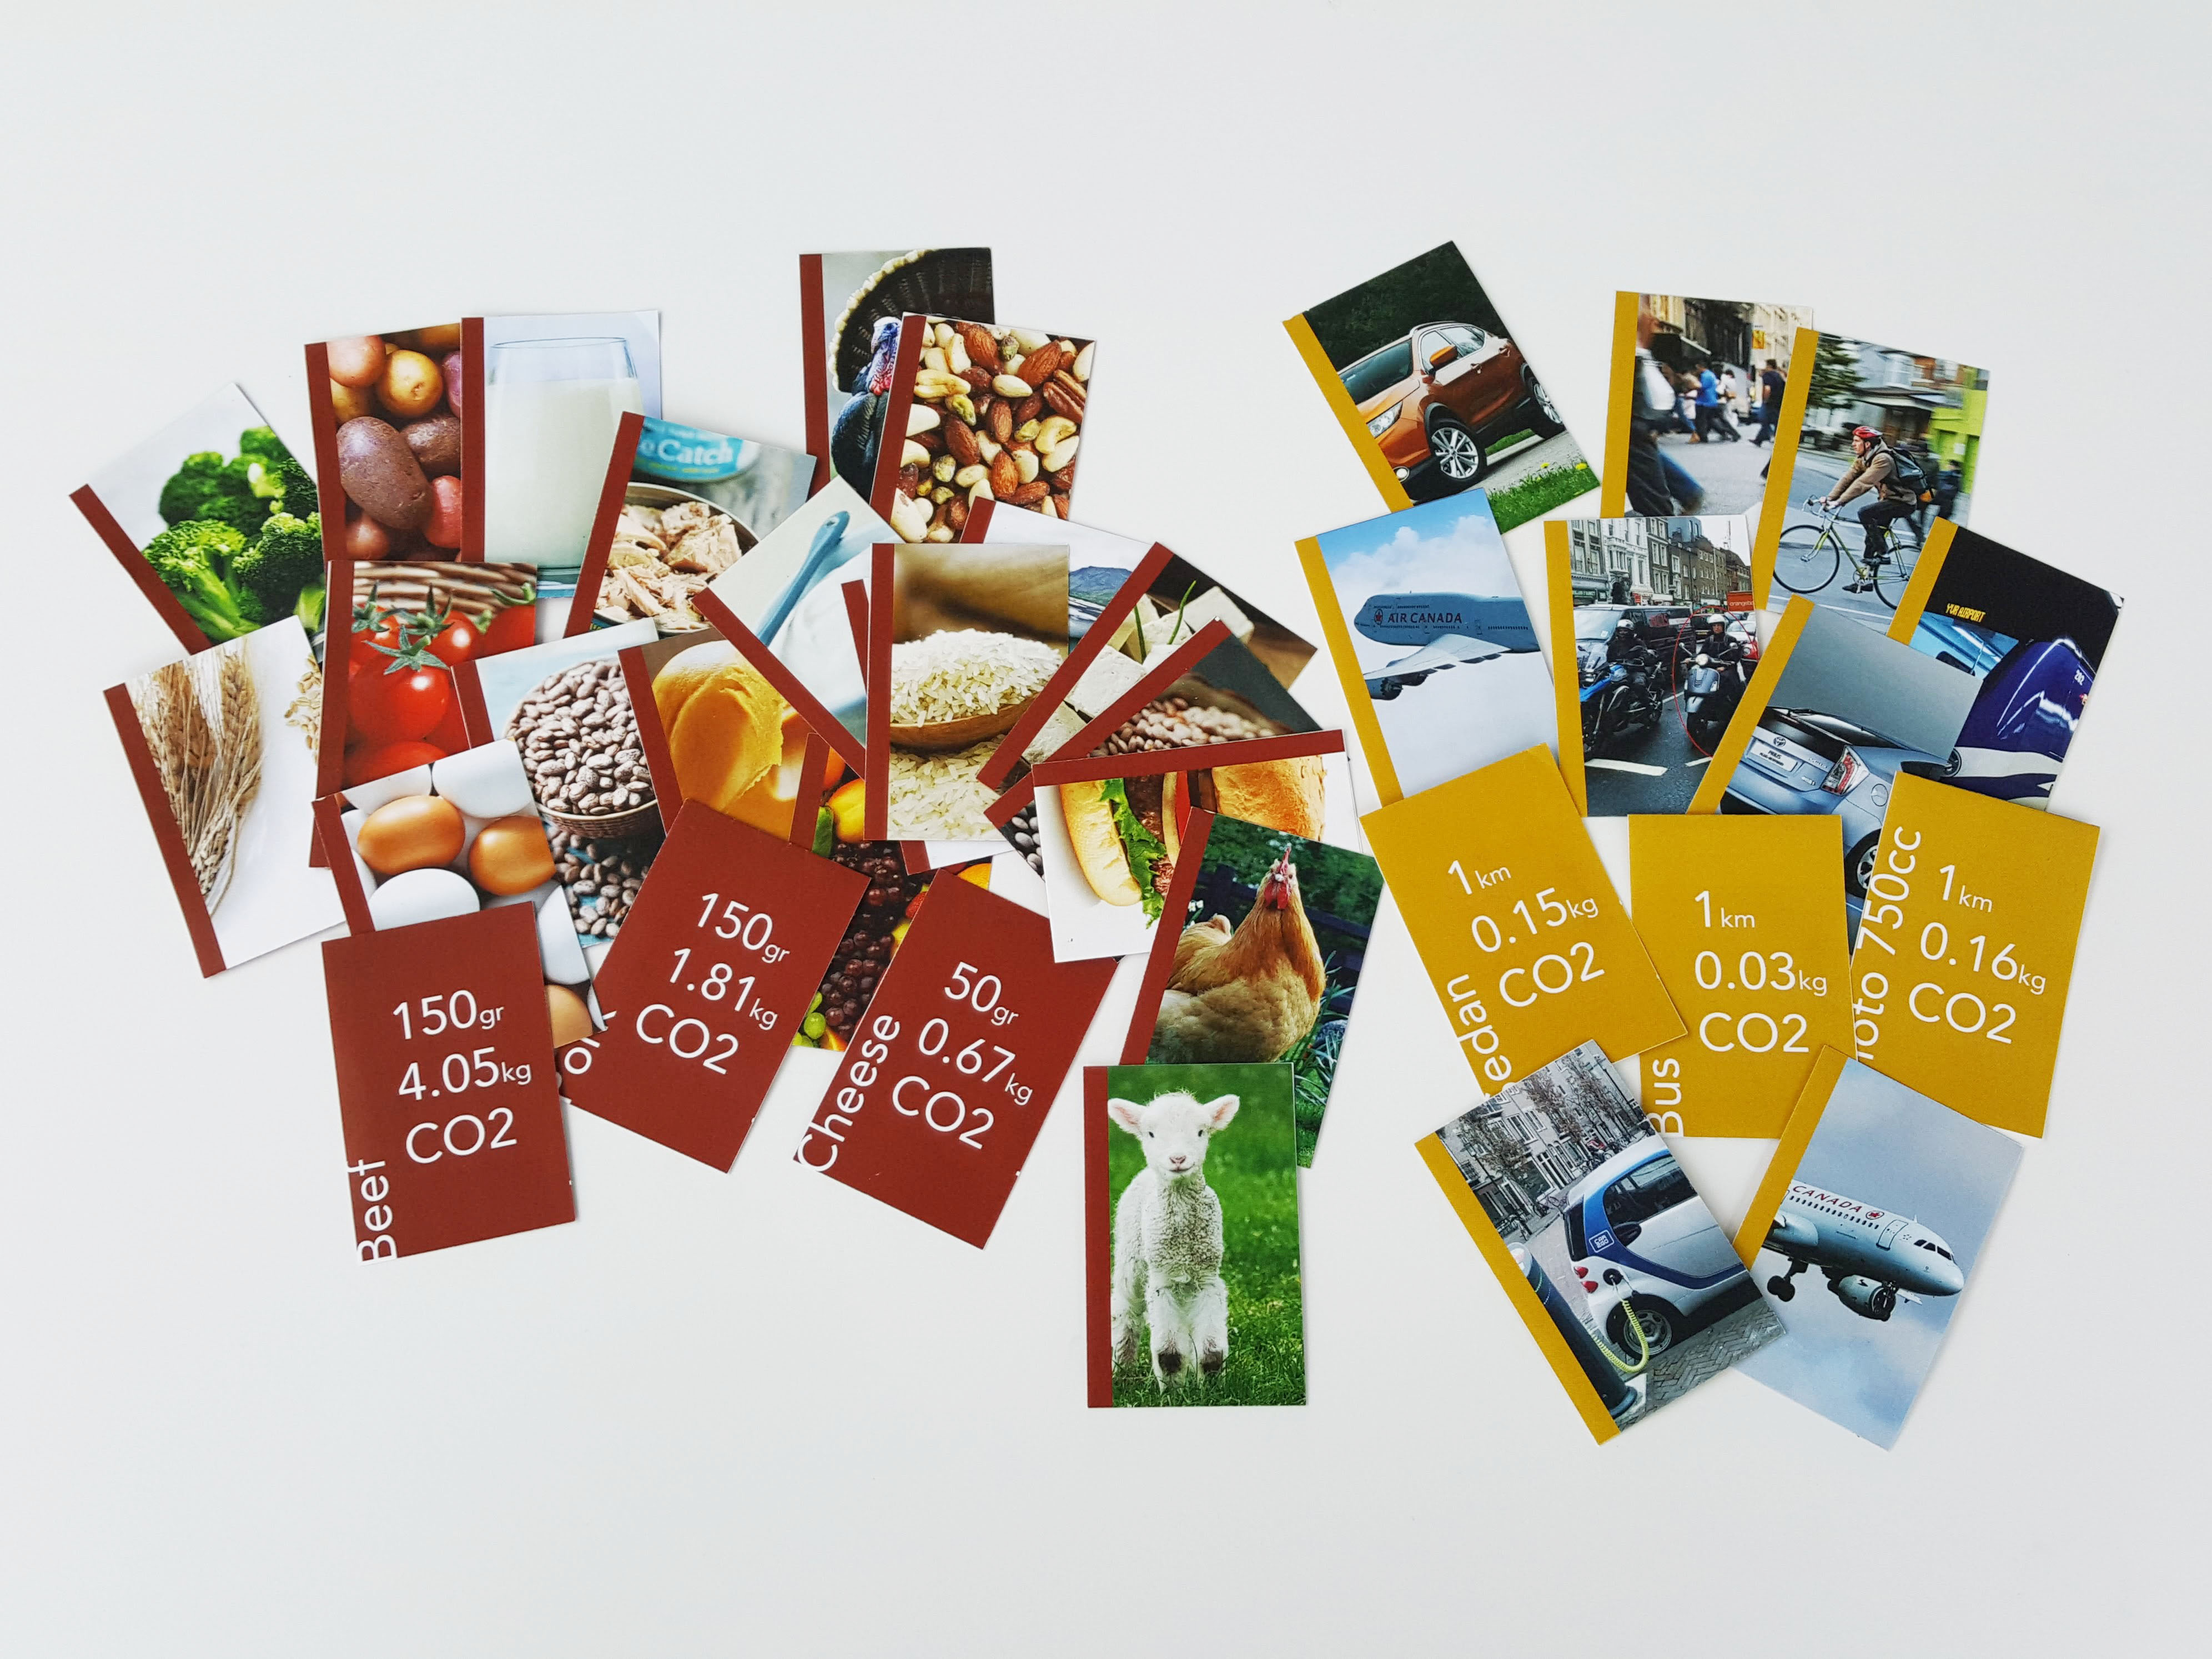
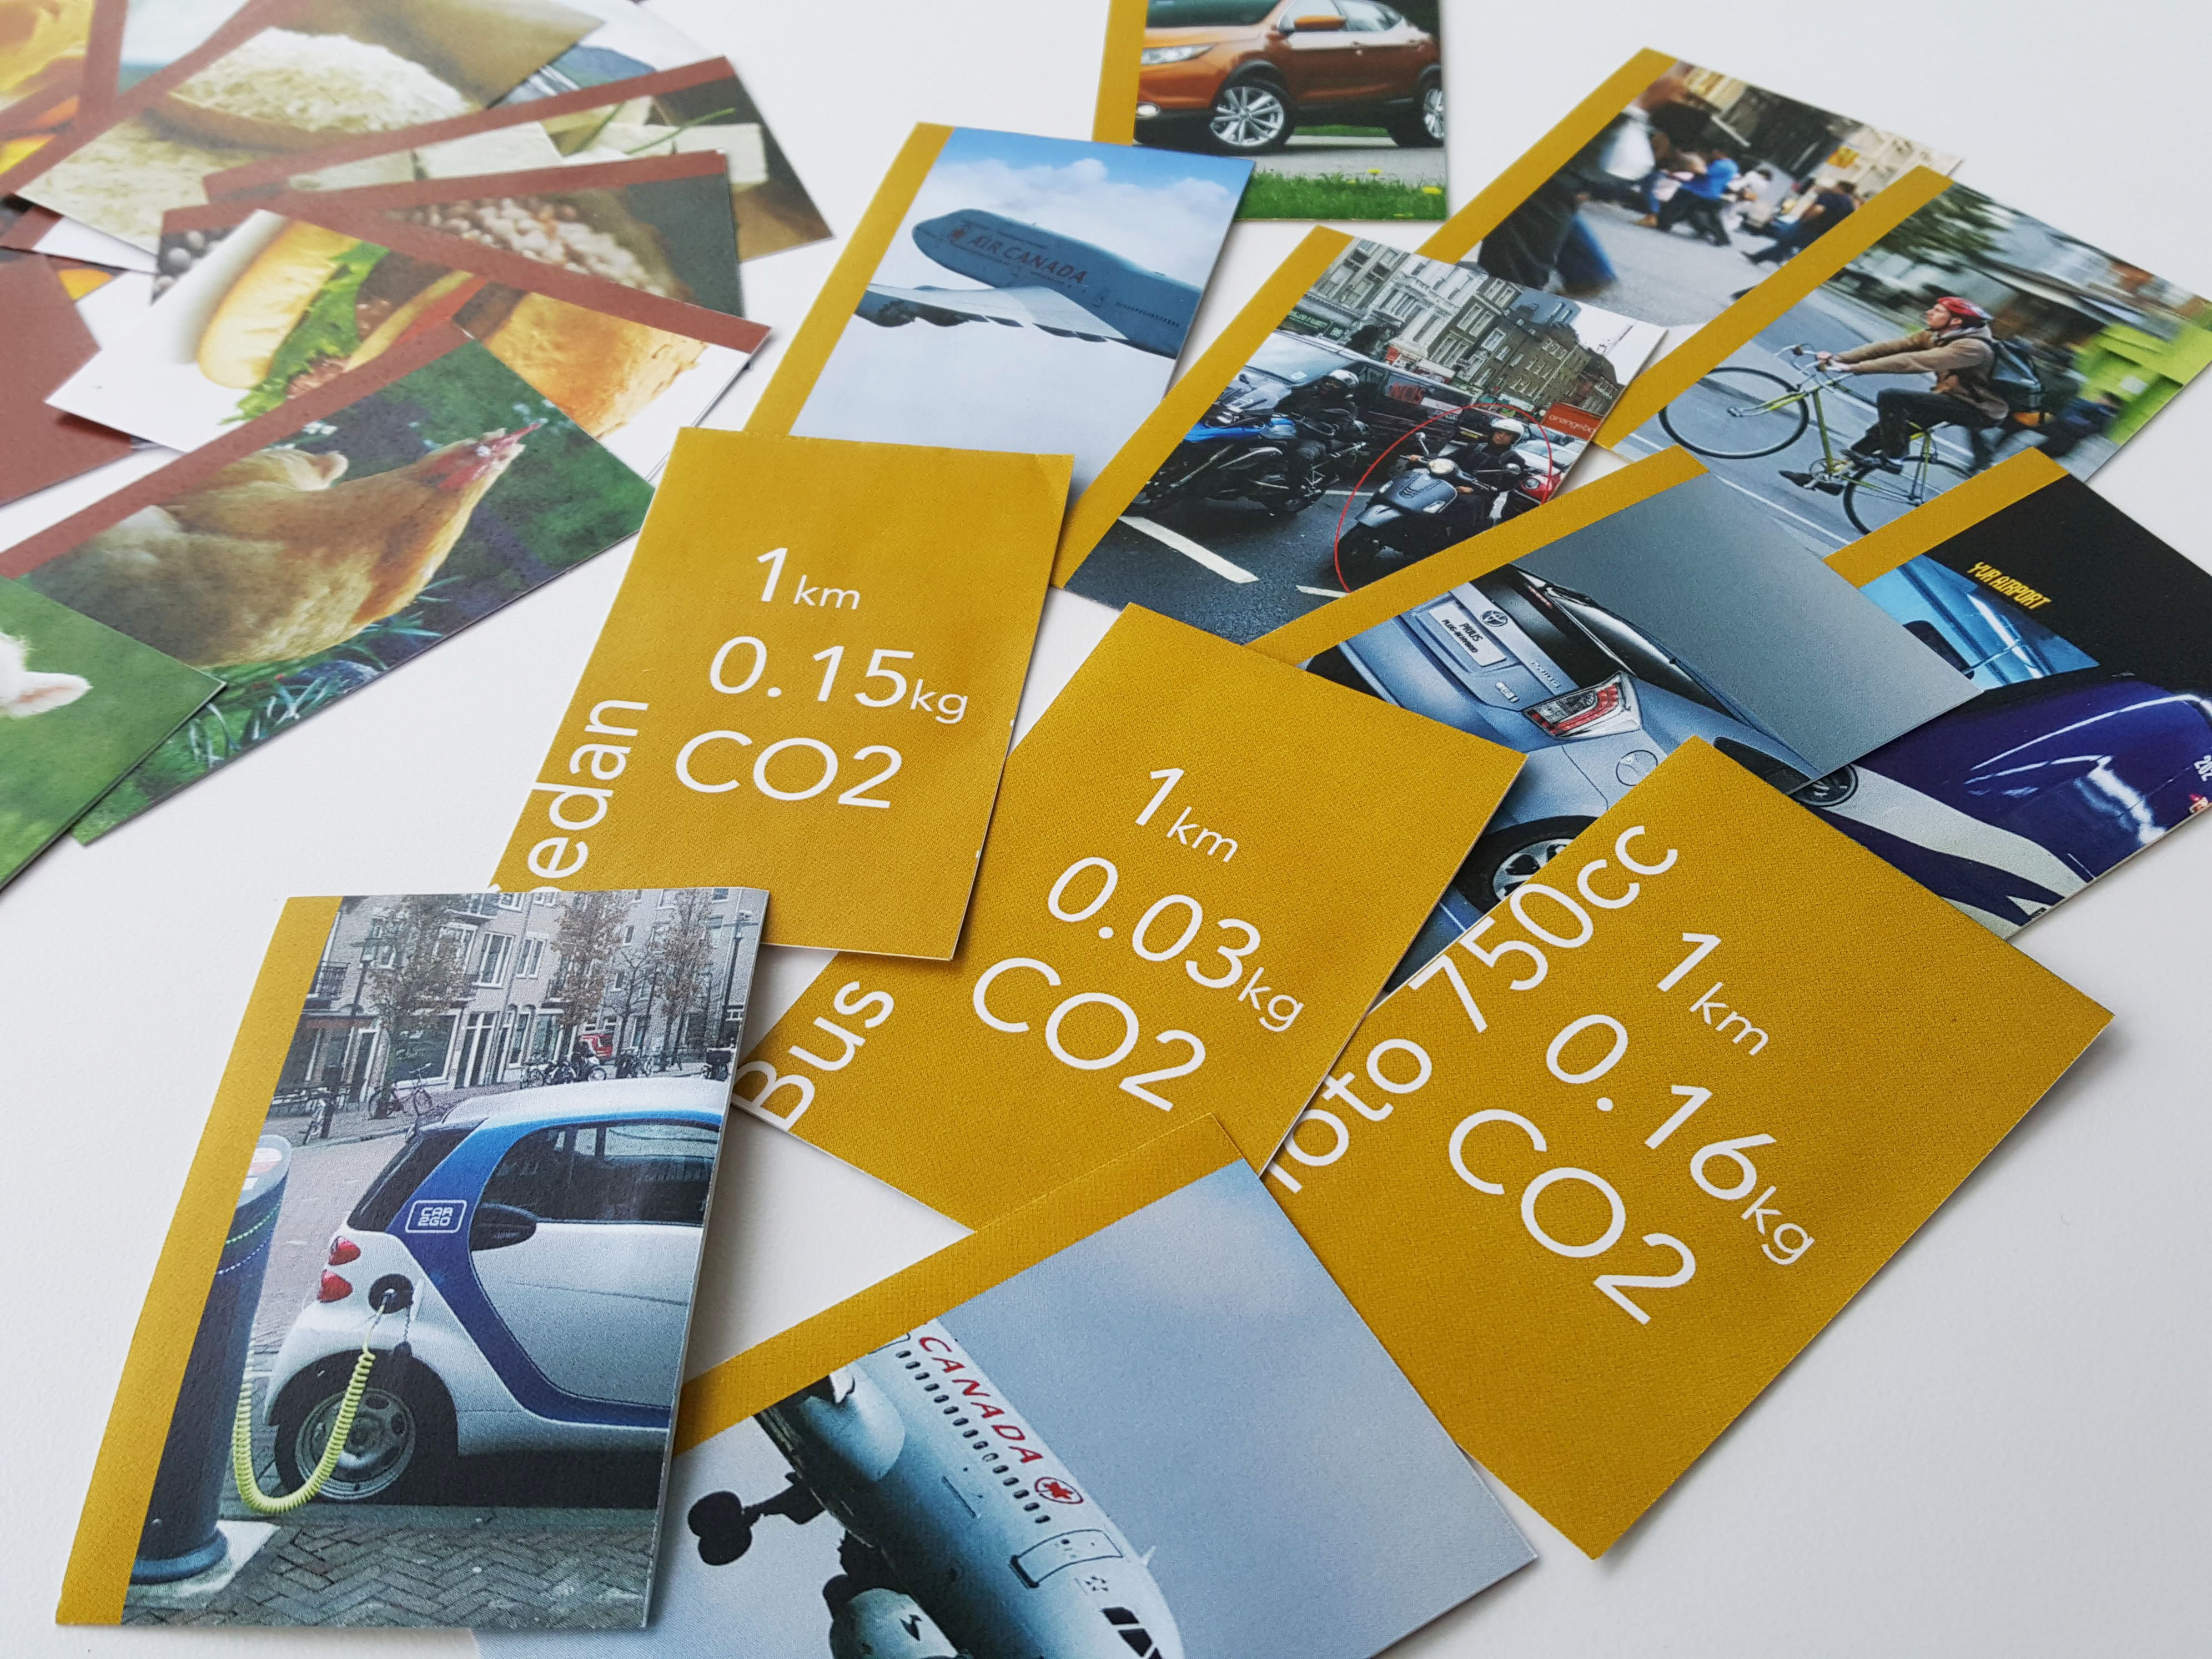
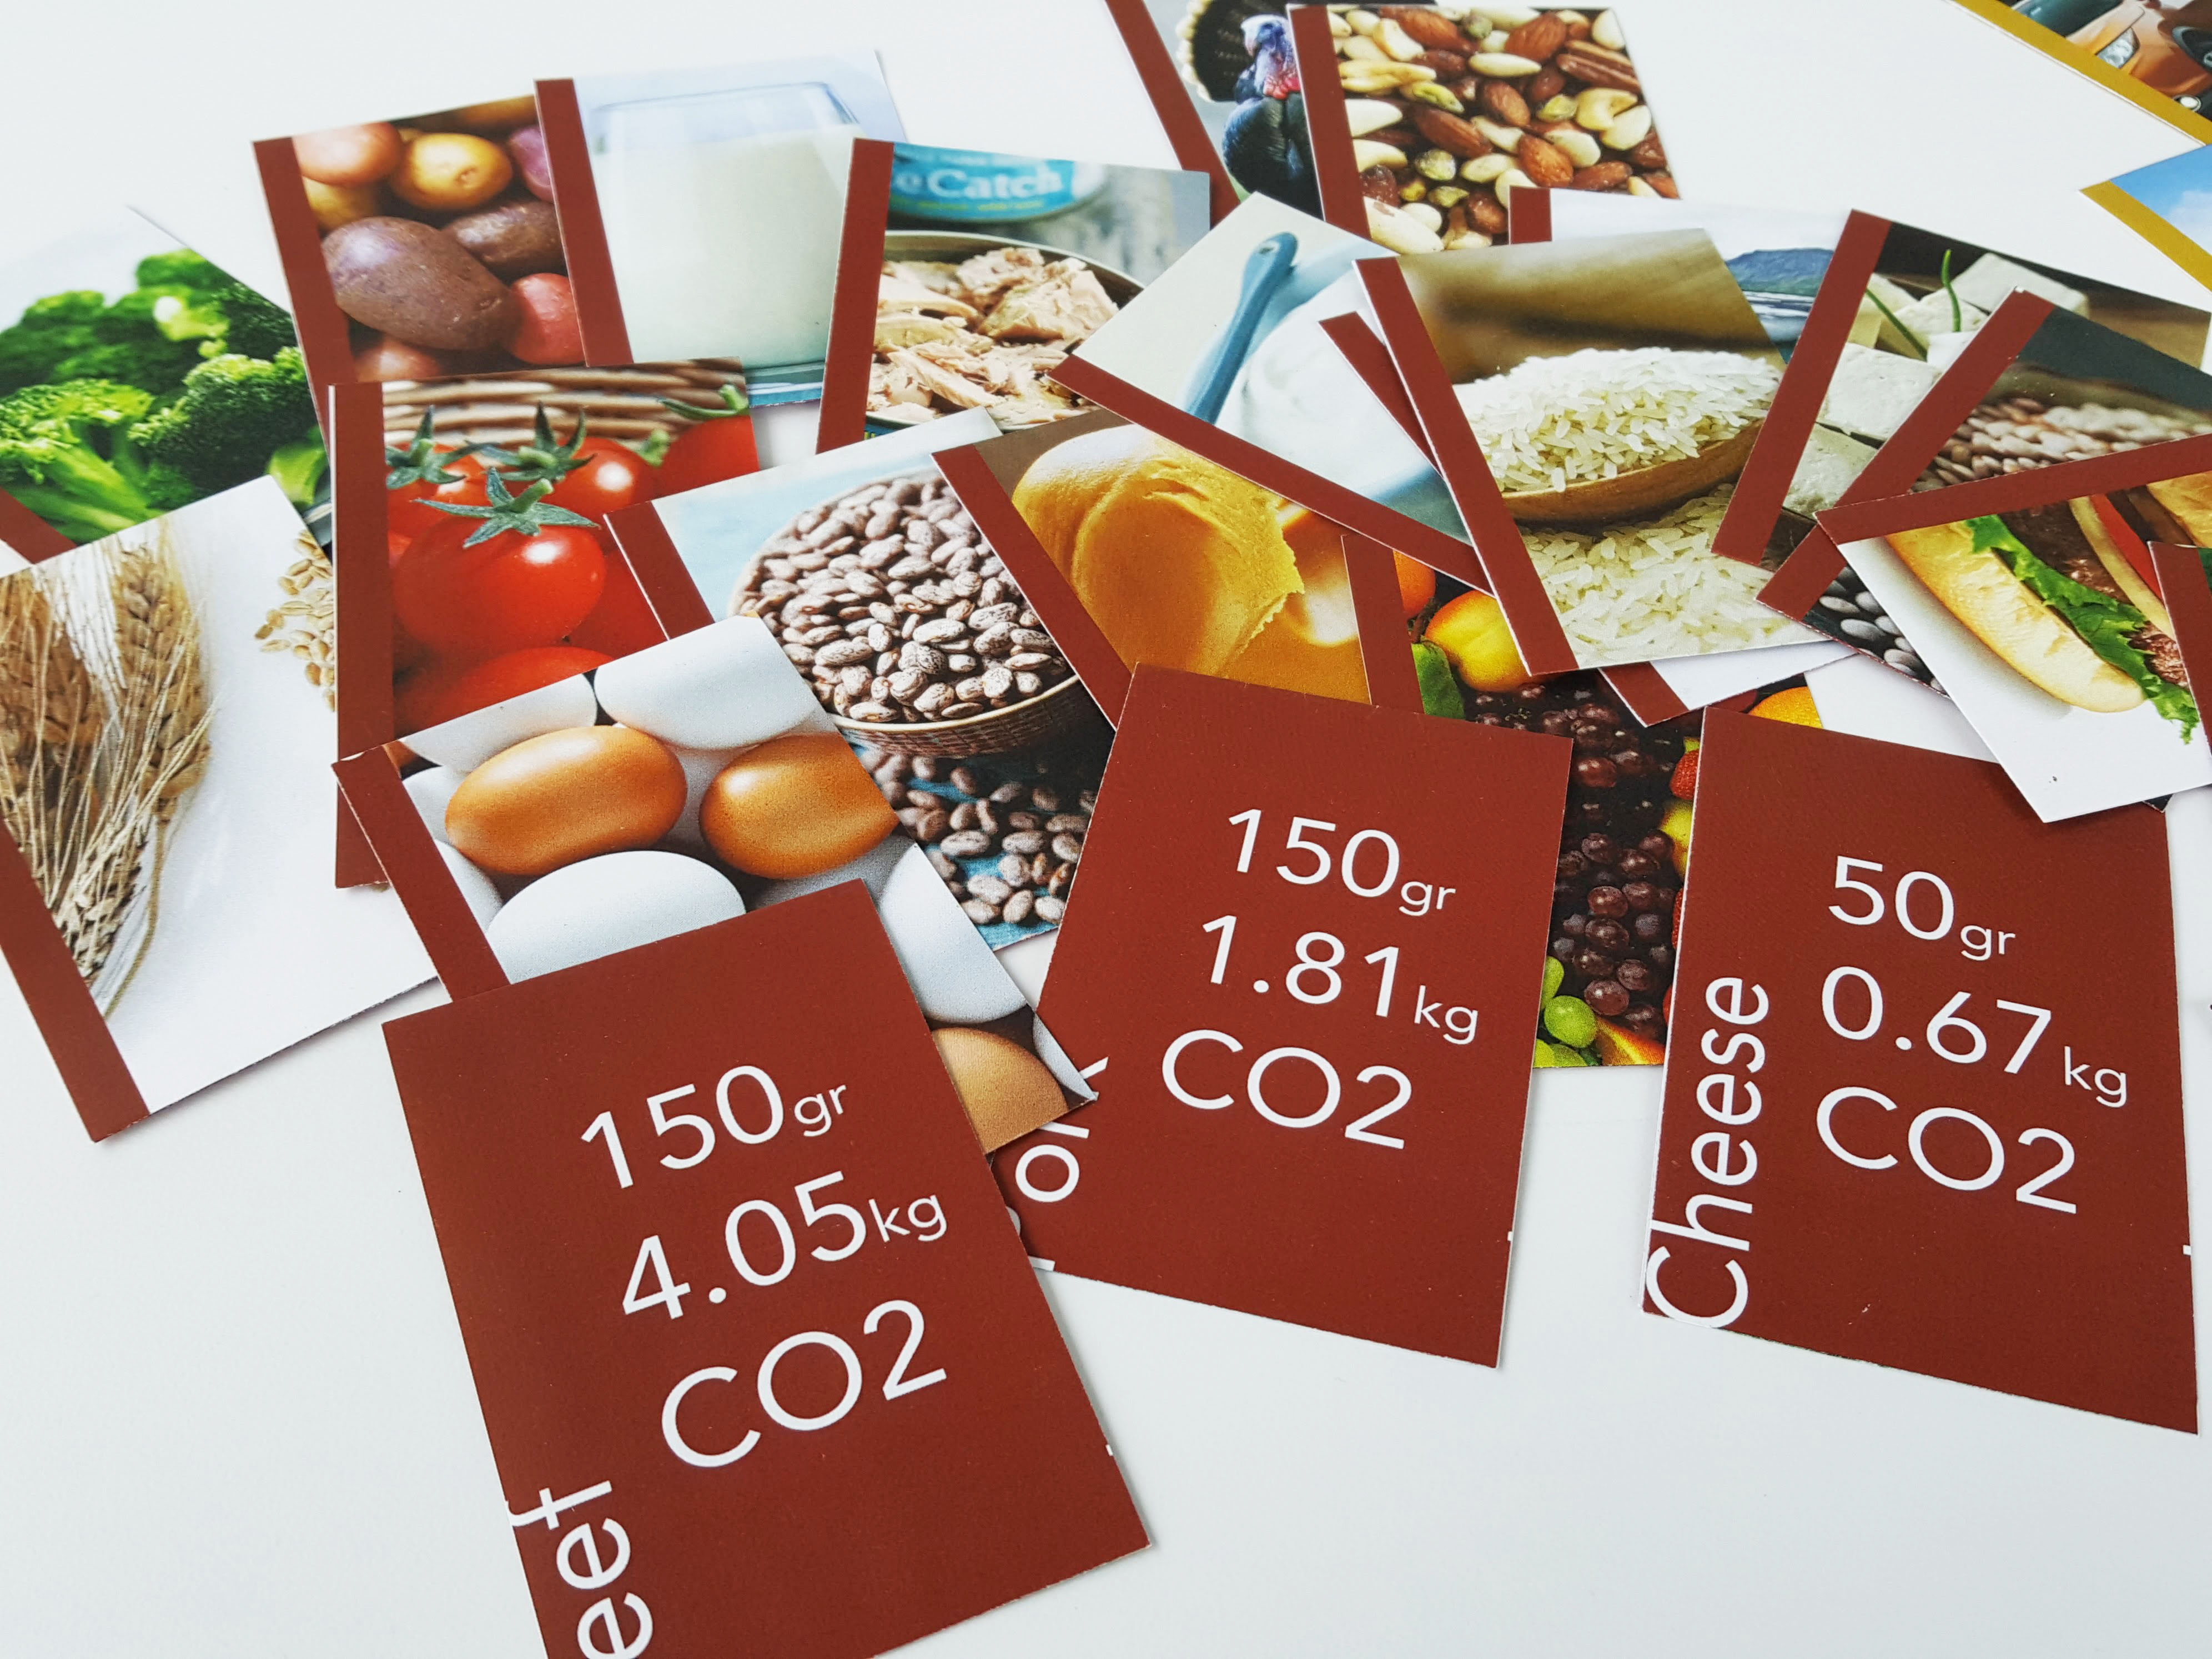
It is quite impressive the impact that human food can have on our planet, going across some data I found CO2 emissions in relation to many different types of food. So I created these cards in order to make this information more accessible to people, together with a small poster that provides a bit of context.
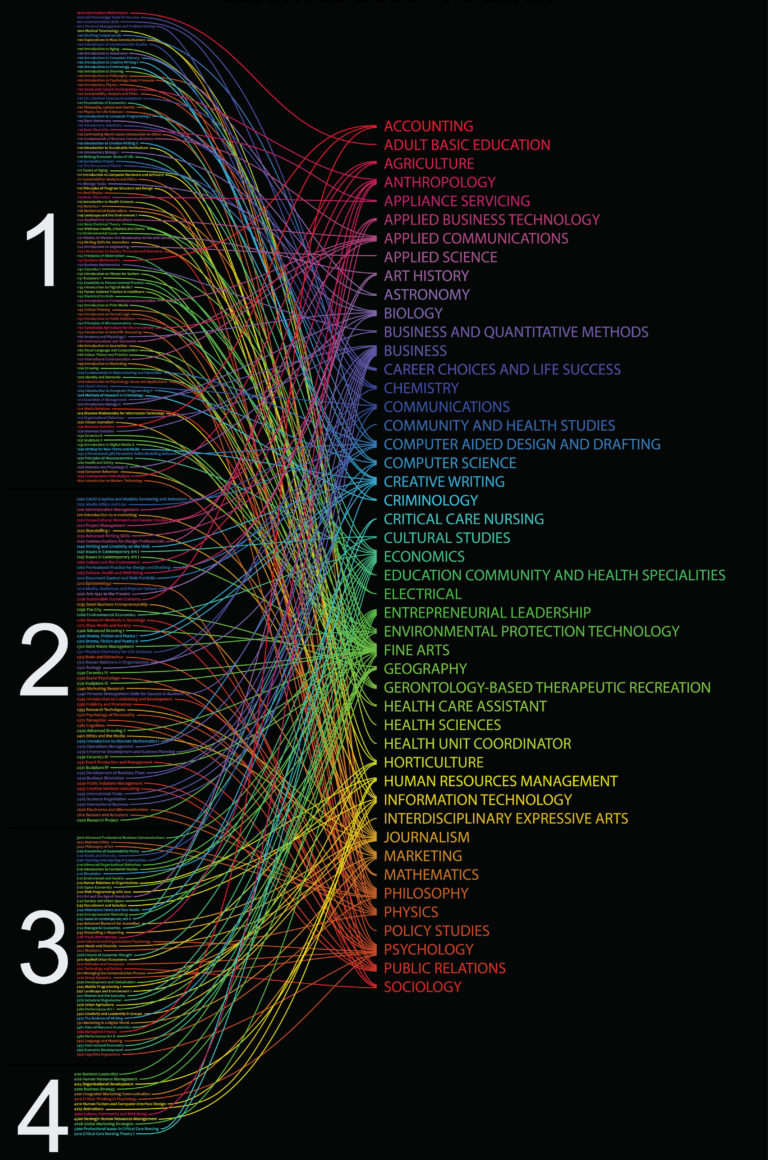
I was part of a committee designing a new degree for the Wilson School of Design, one of the main concepts of this new program was to allow students to take electives from (almost) any program from Kwantlen Polytechnic University. I did some analysis of the possibilities and created this map to visualize them.
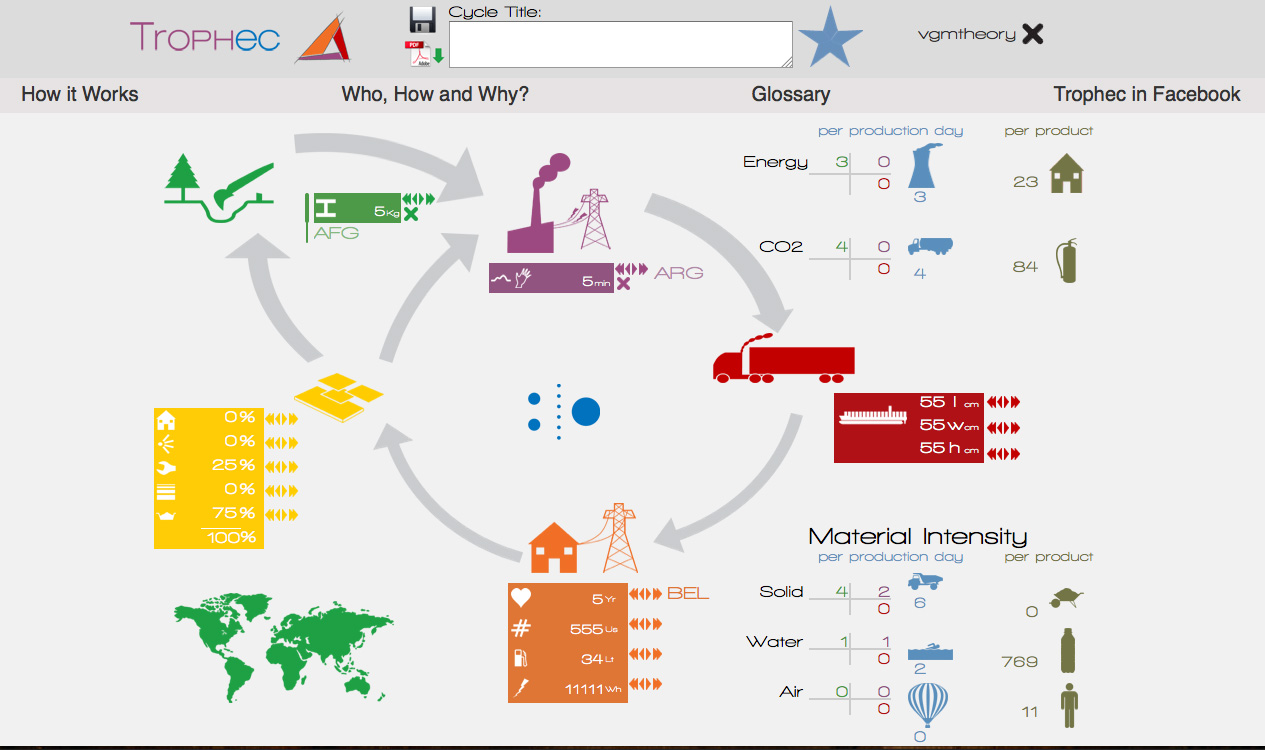
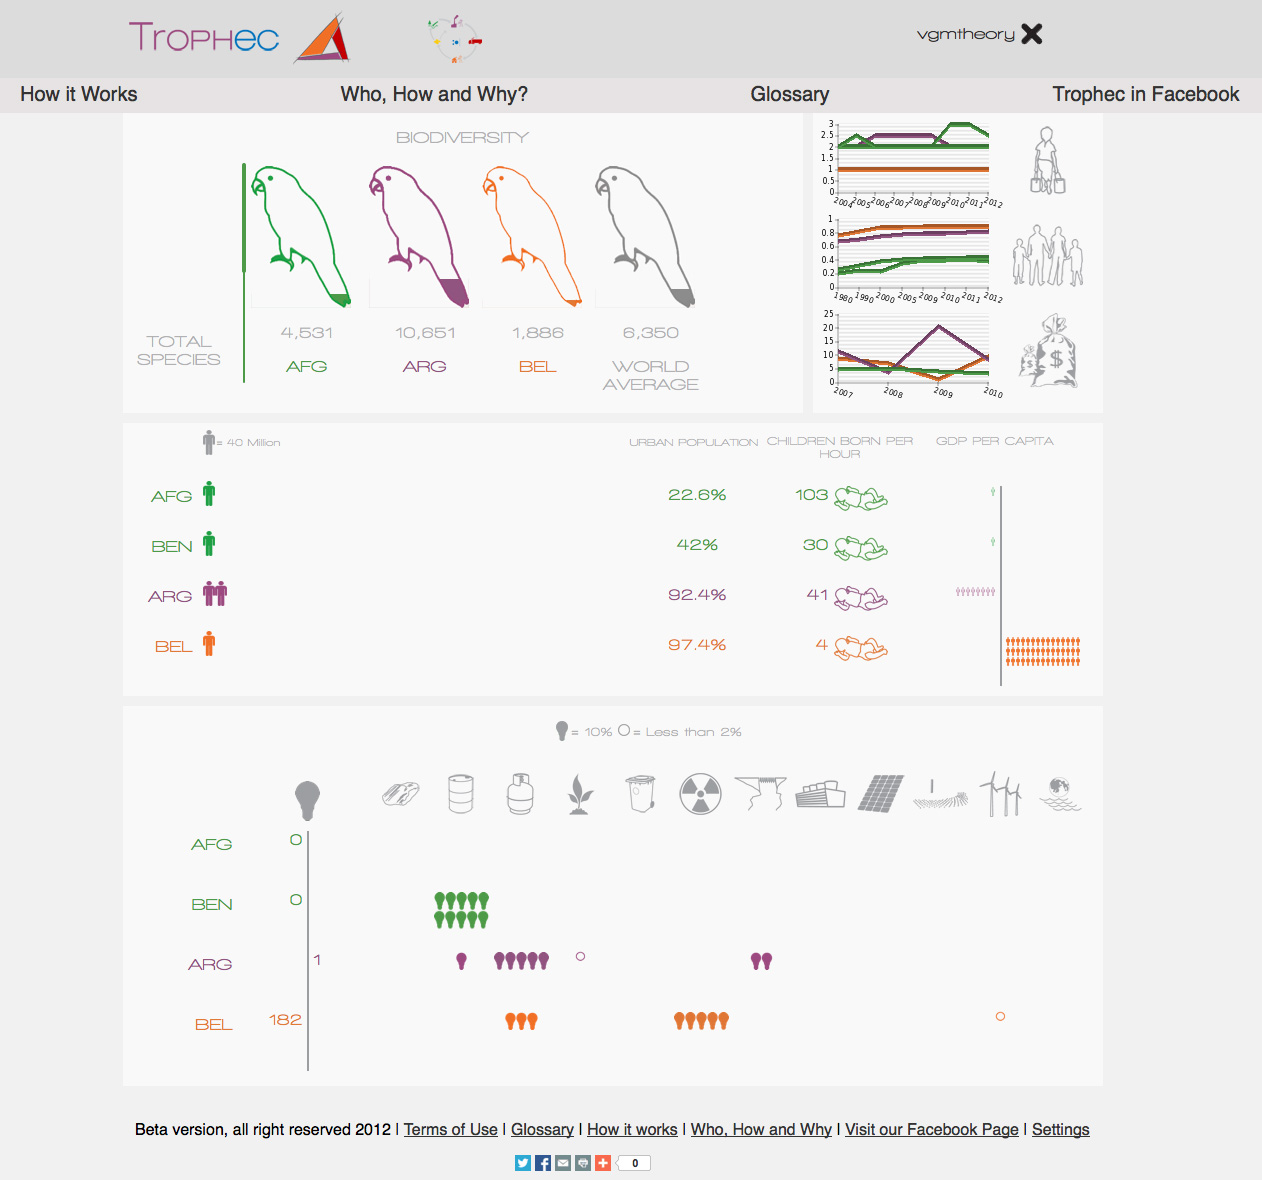
All the icons and overall interface of Trophec was designed by me.
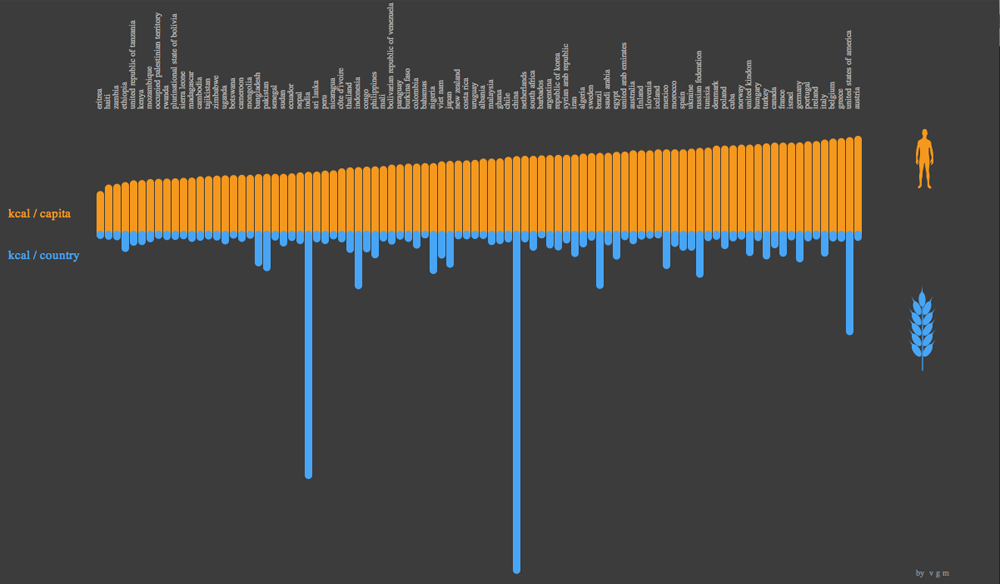
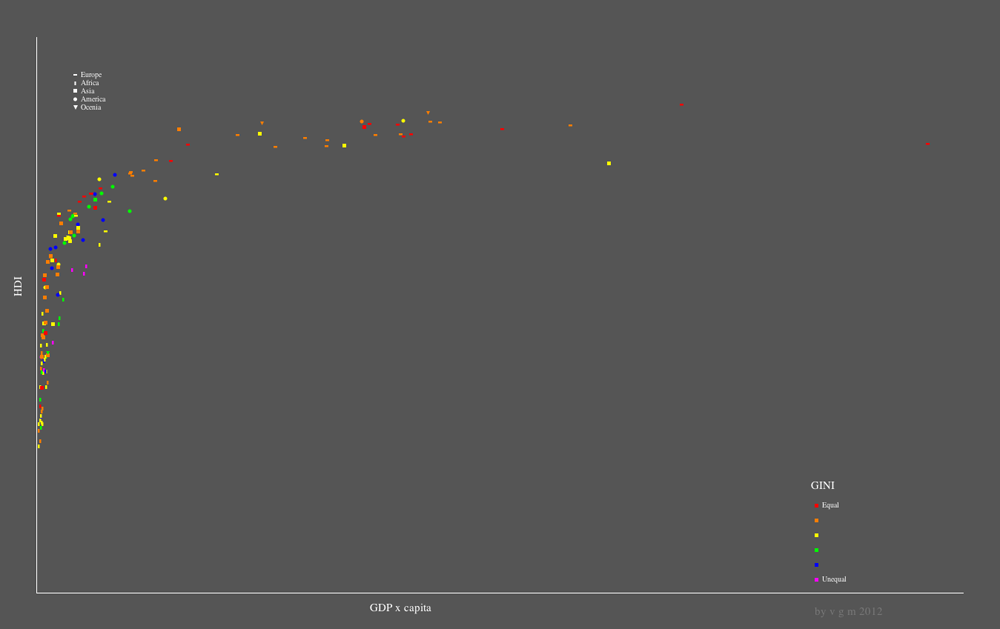
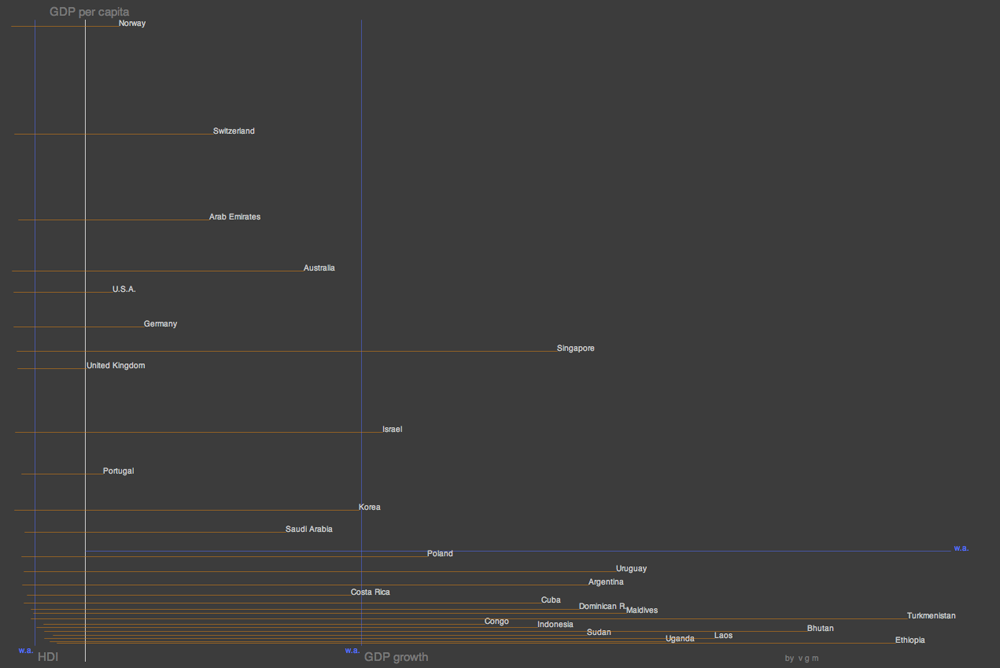
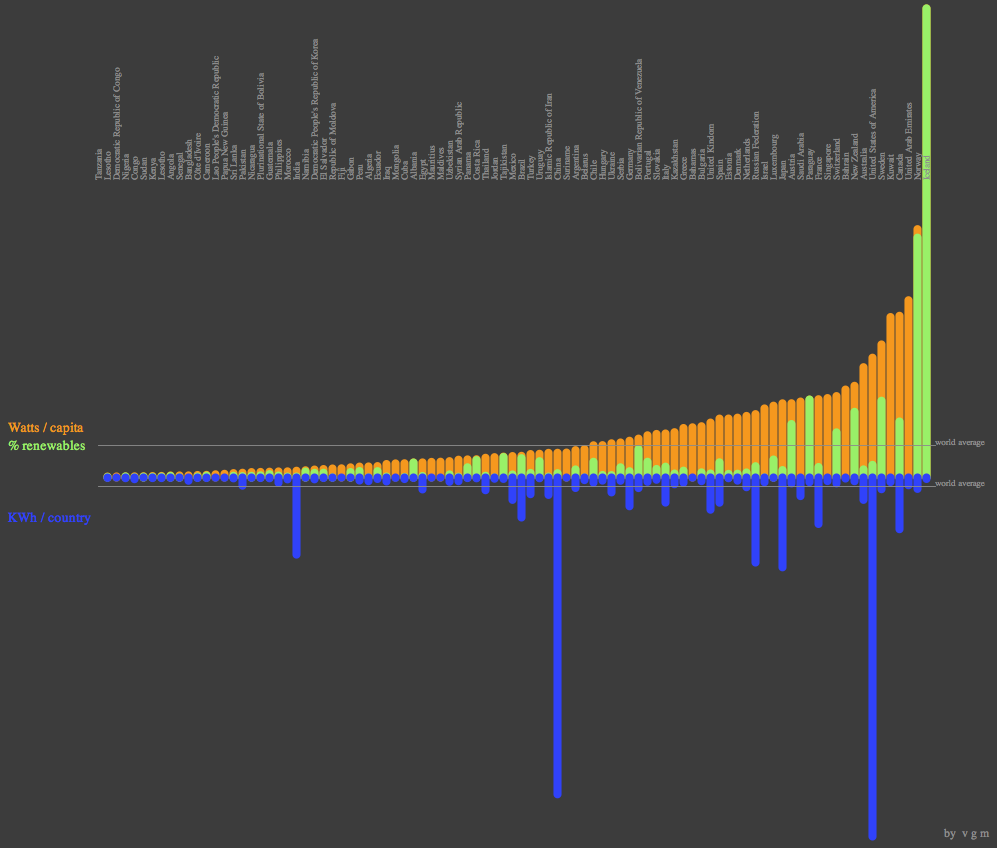
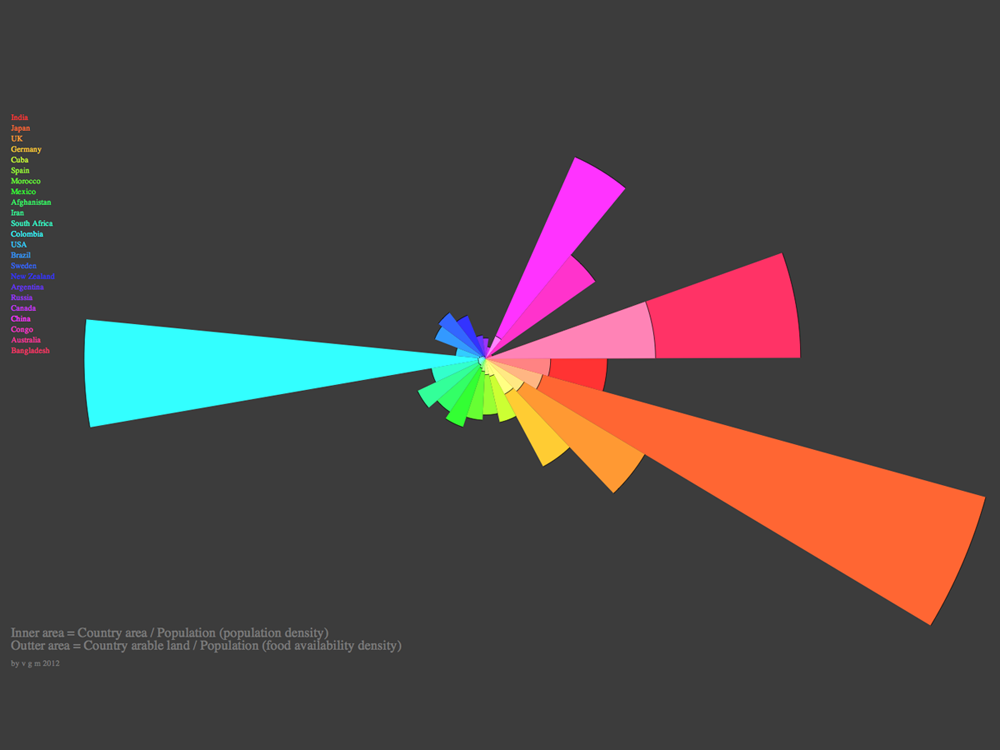
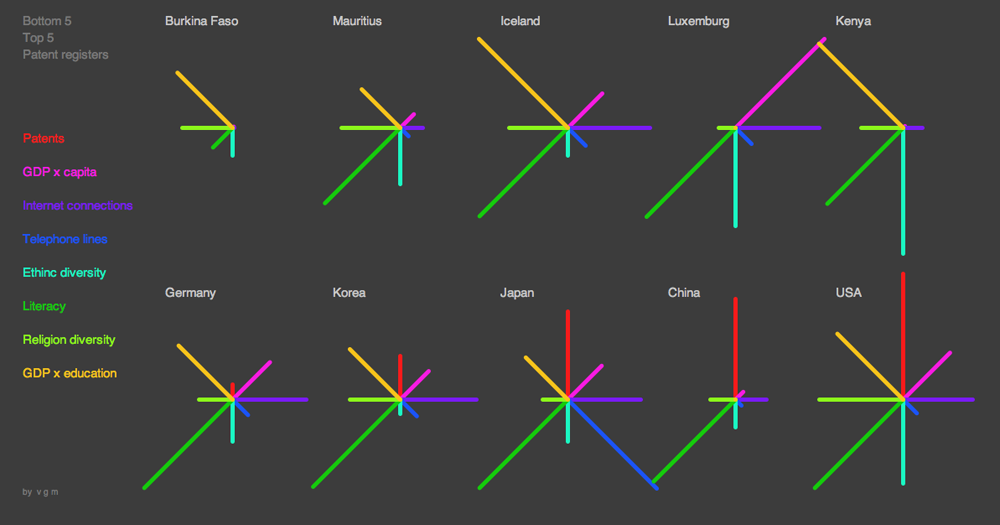
Learning how to code in Processing and using some of the data from Trophec I developed this infographics.
